By Wolf-D. Ihlenfeldt, Xemistry GmbH
Recently, Noel O'Boyle of NextMove software posted two very informative blog entries detailing his solution to a typical ad-hoc problem as it might pop up during the analysis of a structure data set.
The objective of the task is to find the (hydrogen-ignoring) hierarchical substructure/superstructure relationships between compounds in a data set and to generate a (potentially disconnected) set of directed tree-graphs connecting the data set structures.
Algorithmically. this is not too complicated. The approach chosen by Noel is as follows:
This is a nice little problem which is potentially a real-world task, but yet sufficiently exotic that there are no ready-to-run software solutions, at least none I am aware of. On the other hand, this problem does not warrant a full-blown development effort with resources poured into optimization, user-interfaces, etc. This is a typical problem to be attacked with the aid of a high-level, chemistry-aware scripting toolkit.
Noel initially chose Python with OpenBabel extensions. In a second iteration Pat Walters of Vertex Pharmaceuticals improved the rendering of the trees by including structure images. That required a switch to Python with OpenEye extensions. The output was in both cases an image rendered by the dot graph layouter from the GraphViz package.
One of our core products is the Cactvs Chemoinformatics Toolkit, which is a competitor to the Python/Openbabel and Python/OEChem combos. I want to demonstrate that this problem can also be effectively addressed with our toolkit - in a fashion which is more concise, with better re-usability and better suited for further processing of the result.
Since this implementation relies on some recently added features of the network object of the toolkit, running the example code requires base toolkit version of 3.409 or later. Free and up-to-date academic versions of the toolkit can be downloaded from www.xemistry.com/academic.
By the way, in case you are wondering about the unusual nomenclature for nodes (vertex/vertices in the toolkit) and edges (connections in the toolkit) in the following code, this is so that a unique object property name prefix (V_ for vertices, C_ for connections) immediately indicating their associated object class can be used. The E_ prefix is already in use for structure ensemble properties, and N_ for global network properties.
For the sake of re-usability, is is a good idea to encapsulate the core algorithm. To achieve this, we define, with the aid of the property definition editor of the toolkit, a custom data set property D_SUBSTRUCTURE_HIERARCHY of data type network. In order to use the new custom property, you simply fill a data set object with structure objects and request the new property for this data set If the property definition file with its embedded script code is in the search path of a toolkit interpreter, all required computations are then executed automatically. The result is a network object handle, which can be used for example to output the graph data in various formats.
Here is the computation script component of the property definition file:
# recursively link all structures which are matched by the current one, but no other

proc build_tree {nh eh} {
 	upvar matches matches
	set v [vertex create $nh V_NAME [ens get $eh E_NAME]]
	if {$::params(storestructures)} {
		vertex set $nh $v V_STRUCTURE $eh
	}
	if {$::params(storeimages)} {
		prop setparam E_GIF filename $::params(directory)/$v.png
		vertex set $nh $v V_GRAPHICS [list [list image [dict create image [ens new $eh E_GIF]]]]
	}
	set mlist $matches($eh)
	unset matches($eh)
	foreach eh2 $mlist {
		if {![info exists matches($eh2)]} continue
		set found 0
 		foreach a [array names matches] {
			if {$eh2 in $matches($a)} {
				set found 1
				break
			}
		}
		if {!$found} {
			set v2 [build_tree $nh $eh2]
			connection create $nh [list $v $v2]
		}
	}
	return $v
}

proc CSgetD_SUBSTRUCTURE_HIERARCHY {dh} {
 	set nh [dataset set $dh D_SUBSTRUCTURE_HIERARCHY new]
 	network set $nh N_DIRECTED 1
 	prop setparam E_GIF bgcolor black atomcolor element bondcolor white format png \
 		height $::params(imgheight) width $::params(imgwidth) frame 0 bonds 6
	if {$::params(storeimages)} {
		file mkdir $::params(directory)
	}
 	foreach eh1 [dataset ens $dh] {
  		set matches($eh1) {}
 		foreach eh2 [dataset ens $dh] {
  			if {$eh1==$eh2} continue
  			if {[match ss -stereo 1 -isotope 1 -excludeh all $eh1 $eh2]} {
				lappend matches($eh1) $eh2
			}
		}
	}
	while {[array size matches]} {
		set maxe {}
		foreach e [array names matches] {
			if {$maxe=="" || [llength $matches($e)]>[llength $matches($maxe)]} {
				set maxe $e
			}
		}
		build_tree $nh $maxe
	}
}
The line count of this implementation (excluding empty lines, comments and closing brackets) is just 39 lines of code, while it is 61 for for the Python/OEChem implementation (the data set initialization and tree output parts are not counted, because there are also not part of above Cactvs code). That is about 36% less code to write.
I also feel that the Cactvs version is easier to read and understand, but that of course can be debated and depends on the familiarity with the underlying scripting languages and the employed toolkit functions.
More importantly, this code provides functionality which goes significantly beyond the two Python sample implementations, as we will see.
Now, lets use this property.
set dh [dataset create [list {C(O)[C@@H](O1)[C@@H](O)[C@H](O)[C@@H](O)[CH]1(O) Glucose} \
	{C(O)[C@@H](O1)[C@@H](O)[C@H](O)[C@H](O)[CH]1(O) Mannose} \
	{C(O)[C@@H](O1)[C@@H](O)[C@H](O)[C@@H](O)[C@H]1(O) a-Glucose} \
	{C(O)[C@@H](O1)[C@@H](O)[C@H](O)[C@@H](O)[C@@H]1(O) b-Glucose} \
	{C(O)[CH](O1)[CH](O)[CH](O)[CH](O)[CH]1(O) Aldohexose} \
	{c1ccccc1 Benzene} {c1ccccc1Br Br-Benzene} \
	{c1ccc(Br)cc1Br 1,3-DiBrBenzene} \
	{c1cccc(Br)c1Br 1,2-DiBrBenzene} \
	{c1c(Br)cc(Br)cc1Br 1,3,5-TriBrBenzene}]]
set nh [dataset get $dh D_SUBSTRUCTURE_HIERARCHY]
network write $nh subh_text.gv
exec dot -Tpng -osubh_text.png subh_text.gv
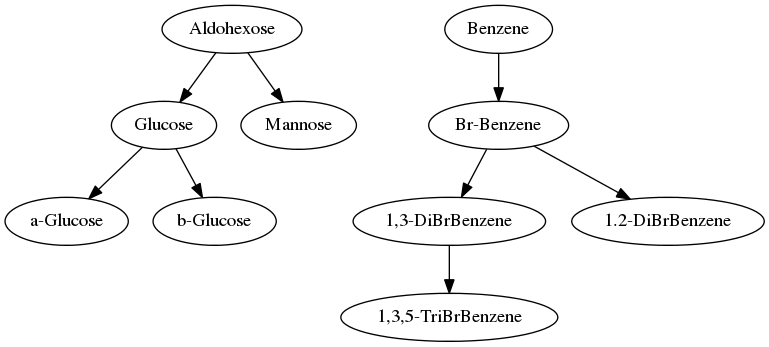
This short block of statements first creates a data set, initialized with structures decoded from SMILES and names set from the part to the right of the SMILES string after the blank. Next, the custom property is requested for the data set using its handle, and the returned handle of the created network object stored in a variable. The network is then written to an output file.
The network object infrastructure of the Cactvs toolkit can read and write about a dozen popular network file formats. If no format is explicitly specified on output, the suffix of the file name determines it. In this case, gv selects the output format of the GraphViz standard format. The dot renderer of the GraphViz suite reads the file without problems, and generates an image, which corresponds to the simple text rendering produced by Noel's initial implementation. The intrinsic structure of the graphs is identical, though the exact layout of the nodes is not the same (file). This is due to different object orderings in the internal data structures of the toolkits.
So what about the advanced second version provided by Pat Walters, which displays structure images and not just names? This functionality is already part of the code, all we need to do is to activate the parameter:
prop setparam D_SUBSTRUCTURE_HIERARCHY storeimages 1
set nh [dataset new $dh D_SUBSTRUCTURE_HIERARCHY]
network write $nh subh_img.gv
exec dot -Tpng -osubh_img.png subh_img.gv
The output module for the GraphViz format already knows the details of how to add images to the graph nodes. The result (file) is shown below, and nicely corresponds to Pat's second implementation:
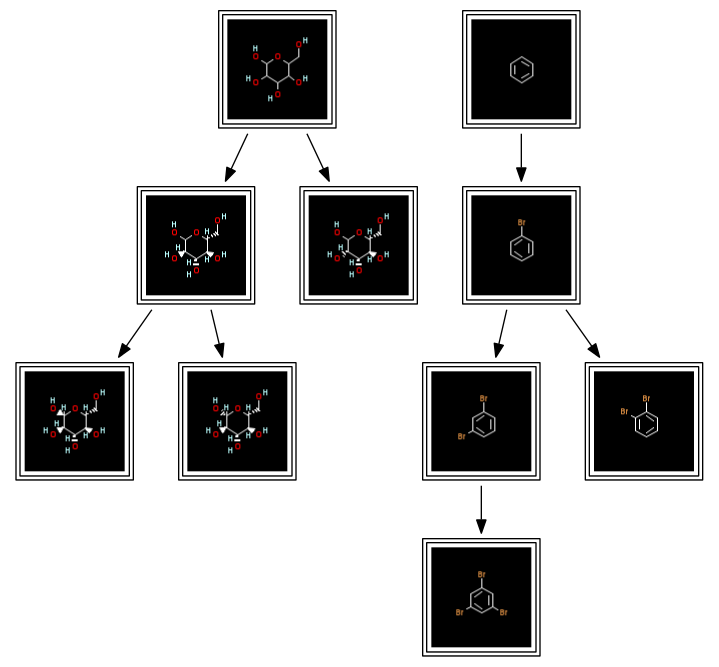
The black background color of the structure icons is just for dramatic effect. It can easily be reconfigured (see prop setparam E_GIF statement in the module code) to match Pat's style pretty closely.
On a side note, it would have been been nice to be able to avoid the use of an image directory and external files. Unfortunately, at least my GraphViz version 2.28.0 does not yet know about data URLs for images, which are easily generated by the toolkit:
prop set E_GIF datatype url
ens get pyridine E_GIF
-> data:image/gif;base64,R0lGODlhtAC0AKUAAKurswAAAG1tcl1dYk5OUQ8PEJycoz4+QR8fIIyMk319gy4uMCgoKlBQVFtbX6GhqAoKC0ZGSmV...
So far, this has more or less been a reproduction of Noel's and Pat's work. But we can do better. The output of the dot renderer is an image - nice to look at, but next to impossible to further process algorithmically. Output of the tree information in a format more suitable for further processing is therefore desirable. One data analysis tool frequently used in chemistry, and with knowledge about networks in general, is KNIME. KNIME comes with reader nodes for two graph file formats which support the storage of rich content: BEEF and its own KNET format. The Cactvs toolkit understands both. So let's get the second result variant with structure images into KNIME:
network write $nh subh_img.knet
That was pretty painless, indeed. Again, the automatic format selection from suffix analysis kicks in. If we read the output file with the standard KNIME network reader node, and connect the standard network visualizer node, it looks like this (file):

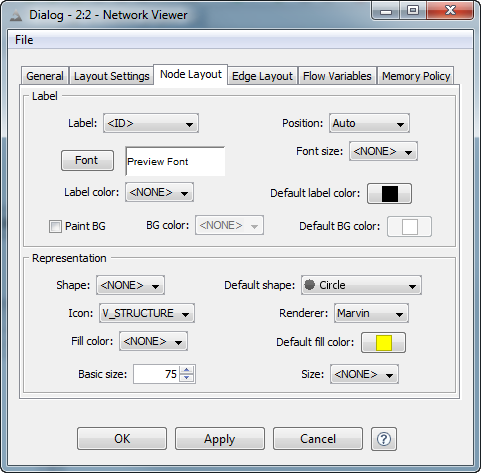
And when the render page of the network viewer is opened (after configuring the node icon size, so that you actually see the icon content and not just a black dot), the result is this:

There are various graph layouters in KNIME to choose from, and lots of options to further configure the rendering. But most importantly, the KNET format reader delivers a live KNIME network port to the workspace. The network can be further processed by connecting it to other network nodes, or, after feature extraction, to a broad selection of other data analysis nodes.
Still, until this stage, we have only transferred images to KNIME, and these are intrinsically passive data. In order to connect the structure data contained in the network to the chemistry tools in KNIME, they need to be transferred as structure data nodes. That is an easy task for the Cactvs toolkit, and again already supported in the core algorithm script:
prop setparam D_SUBSTRUCTURE_HIERARCHY storestructures 1
set nh [dataset new $dh D_SUBSTRUCTURE_HIERARCHY]
network write $nh subh_sdf.knet
The activated parameter instructs the Cactvs toolkit to store copies of the structures used to construct the trees as objects in standard V_STRUCTURE node properties. The KNET network file I/O module of Cactvs knows how to translate this information into proper KNET encoding so that structures become available as SDF cells in KNIME (file). Reading the structure-enhanced KNET file with the standard network reader of KNIME, and configuring its network viewer to use the V_STRUCTURE property as node label (here choosing the Marvin renderer to handle the display, any other available SDF renderer in your KNIME installation may be freely substituted) results in the following display:

I hope to have shown with this short tutorial how the Cactvs toolkit can be used to solve non-trivial chemistry information processing tasks in an effective manner, leveraging advanced functionality which is not readily available in other toolkits.
Comments are welcome!